Generate and plot random planes using python

General introduction to planes and plotting
In geology a basic plane can be rappresented by different parameters linked to the orentation of the plane in respect to the cardinal points and the inclination of the plane in respect to the horizontal. The first parameter can be expressed in different ways but the main two are:
- Strike
- Dip direction
The second parameter on the other hand is defined only by one value defined as the Dip angle
The strike and dip direction of a plane are strictly linked.
The strike is defined as the direction given by the intersection line between the given plane and a horizontal plane. The dip direction is the angle orthogonal to the strike.
As an example a plane with 90° of strike has a dip direction of 180°. To visualize this relationship we can use the right hand rule:
the thumb coincides with the direction while the direction of fingers (palm facing downward) the dip direction of the plane.
This way with a value of strike = 90° we can extrapolate that the plane has a direction of 90° and it is dipping South (180°).
These basic parameters can be very usefull in geology to understand the general orientation of rock strata encountered on the field and so their overall geometry.
Plotting planes
To efficiently analyze the gathered data we can use stereoplots. These kind of plot are obtained as the equatorial projection of the intersection of a plane or line typically with the southern hemisphere of a sphere. In this way planes are rappresented as curves while lines as dots. When we have a high number of planes some patterns can emerge such as planes dipping in the same general direction and with similar inclination angles. This grouping is called a set of planes. On stereoplots defining sets can be very difficult especially if there are lots of sets and planes with different orientation. To semplify the view usually poles are used1.
mplstereonet
Using the mplstereonet library we can plot geological data as lines or poles by giving the appropriate strike and dip measurements of the given plane. The process to generate random planes is not that complex since the values that need to be generated are only two.
First we need to install the two main libraries: mplstereonet and numpy using pip:
pip install mplstereonet numpy
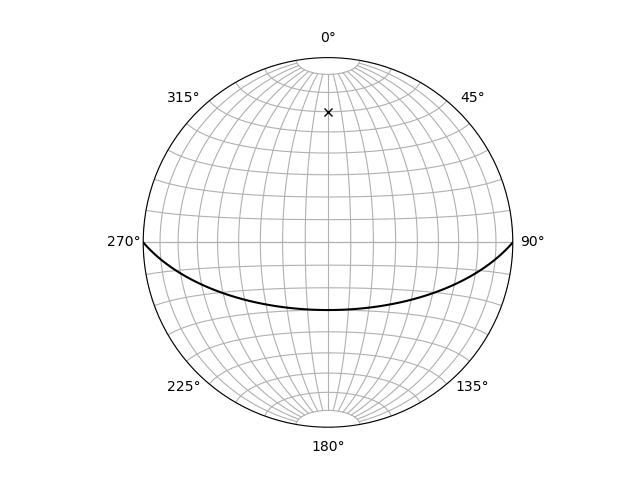
Now we can start scripting. Let’s plot a simple plane with 90° strike and 60° dip angle.
import mplstereonet as mpl
import matplotlib.pyplot as plt


strike = 90 #strike value
dip = 60 #dip value

fig = plt.figure('Stereoplot') #initialize a figure with the name 'Stereoplot'

ax = fig.add_subplot(111,projection='stereonet') #add plot in the figure with the stereonet projection
ax.grid() #add a grid

ax.plane(strike,dip,'k-') #plot the plane data as a black line
ax.pole(strike,dip,'kx') #plot the corresponding pole of the plane as a black x


plt.show() #show the plot
Adding random measurements can be archived using numpy random library
import numpy.random as r
import mplstereonet as mpl
import matplotlib.pyplot as plt


strike = r.randint(0,361) #random strike value (range from min to max-1)
dip = r.randint(0,91) #random dip value

print(f'strike:{strike}, dip dir:{(strike+90)%360}, dip:{dip}') #print string to display the strike, dip dir and dip values.

'''
The dip direction can be calculated by adding 90°and
applying the reminder operator % to constrain the result to max 360.
For example if the strike is 300 the dip direction will be 30°
because 390%360 = 30.

'''

fig = plt.figure('Stereoplot') #initialize a figure with the name 'Stereoplot'

ax = fig.add_subplot(111,projection='stereonet') #add plot in the figure with the stereonet projection
ax.grid() #add a grid

ax.plane(strike,dip,'k-') #plot the plane data as a black line
ax.pole(strike,dip,'kx') #plot the corresponding pole of the plane as a black x


plt.show() #show the plot
The plot will be similar to the figure of the first examlpe but with a random value of strike and dip angle.
If we want more than one plane we can create a numpy array of random values that can be plotted. This can be accomplished by modifying the lines
strike = r.randint(0,361,5) #5 random strike values (range from min to max-1)
dip = r.randint(0,91,5) #5 random dip values
matplotlib is able to unpack and plot the different strike;dip pairs from the two lists.
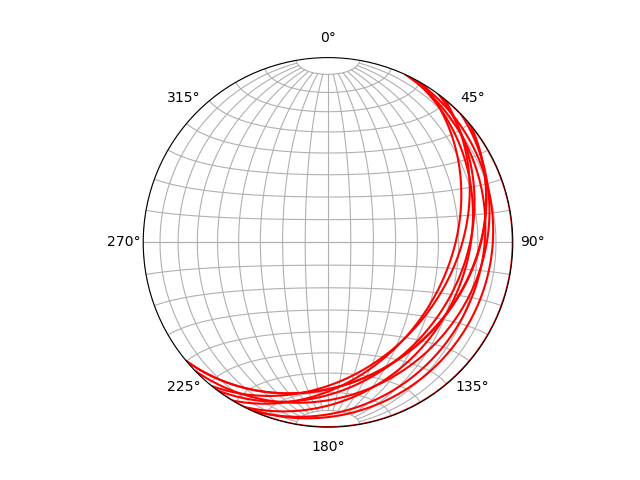
A more complex approach is by introducing the concept of plane set. We need a number of planes with the same general orientation and inclination. To do this we can:
- Define a random “generator” plane. This will define the direction and dip of the set
- Generate random data based on the generator direction and dip
To give the set a more “natural feeling” we can use a random number given by a normal distribuition with:
$$\mu = \text{strike} \text{ or } \mu = \text{dip} $$
and random $\sigma^2$.
import numpy as np
import matplotlib.pyplot as plt
import mplstereonet as mpl
def random_plane_gen(sets=1, n_planes=10):
r_s = np.random.randint(0,361,sets) #random strike
r_dip = np.random.randint(0,91,sets) #random dip
r_std = np.random.randint(5,20,sets) #random sigma^2
planes_dict = {x:{'s':0,'d':0} for x in range(sets)}
'''
We can use dictionaries to be more tidy.
For every set there is an entry
0:
+ s: 0
+ d: 0
1:
+ s: 0
+ d: 0
that then can be filled:
0:
+ s: 120
+ d: 20
1:
+ s: 200
+ d: 33
'''
for nset,s,d,std in zip(list(range(sets)),r_s,r_dip,r_std):
#take only the absolute values of n_planes random values with center s and given sigma^2 rounded to 2 decimals
planes_dict[nset]['s'] = np.abs(np.round(np.random.normal(s,std,n_planes),2))
planes_dict[nset]['d'] = np.abs(np.round(np.random.normal(d,std,n_planes),2))
return planes_dict
random_set = random_plane_gen()
print(random_set) #print dict
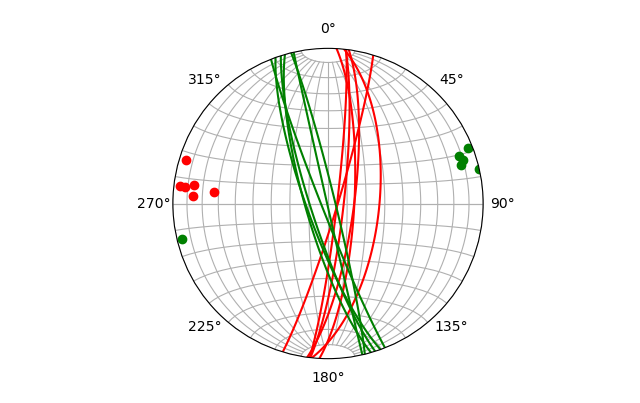
def plane_plot(planes_dict,show_planes=1,show_poles=0):
#plot with different colors depending on the set (0:red, 1:green, ...)
set_color = ['r','g','b','k','m','c']
fig = plt.figure('Stereonet')
ax = fig.add_subplot(111, projection='stereonet')
for sets in planes_dict: #for every set present in the dict
for i in range(len(planes_dict[sets]['s'])):
if show_planes:
ax.plane(planes_dict[sets]['s'][i],
planes_dict[sets]['d'][i],
f'{set_color[sets]}-')
if show_poles:
ax.pole(planes_dict[sets]['s'][i],
planes_dict[sets]['d'][i],
f'{set_color[sets]}o')
ax.grid()
plt.show()
plane_plot(random_set)
-
Poles are artificial lines normal to the surface of a given plane. ↩︎
Gabriele Benedetti
Research assistant University of Milano-Bicocca
MSc in Geology and Geodinamics with the knack